


Azure Hands-On Labs - Configure VM Monitoring
Azure Learning Path for Cloud and DevOps Engineers


📝Introduction
This post demonstrates this hands-on lab, where we walk through configuring Log Analytics to set up virtual machine monitoring and make sure that it will work with our on-premises servers as well as those within Azure.
📌Note: For this lab, I have created a VM Windows Server 2016 Datacenter B1ms (1 vcpu, 2 GiB memory).
📝Log in to the Azure Management Console
Using your credentials, make sure you're using the right Region. In my case, I am using westus.
📌Note: You can also use the VSCode tool or from your local PowerShell to connect to Azure PowerShell
More information on how to set up it is on the link.
📝Prerequisites:
Update to PowerShell 5.1, if needed.
Install .NET Framework 4.7.2 or later.
Visual Code
Web Browser (Chrome, Edge)
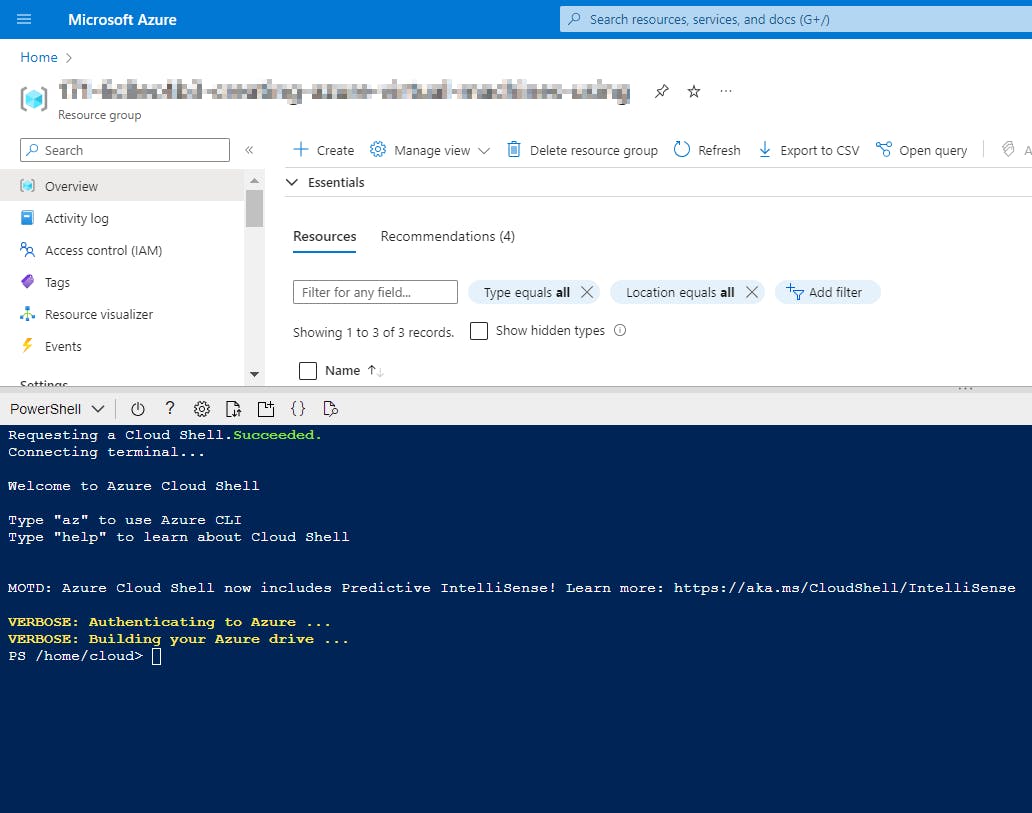
📝Setting an Azure Storage Account to Load PowerShell
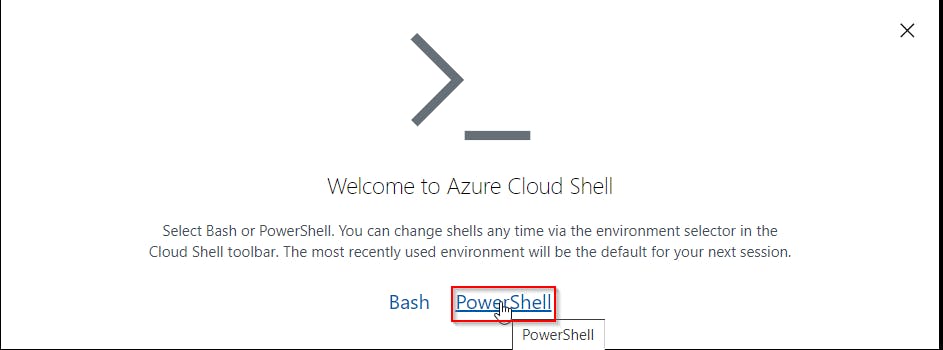
- Click the Cloud Shell icon
(>_)at the top of the page.

- Click PowerShell.
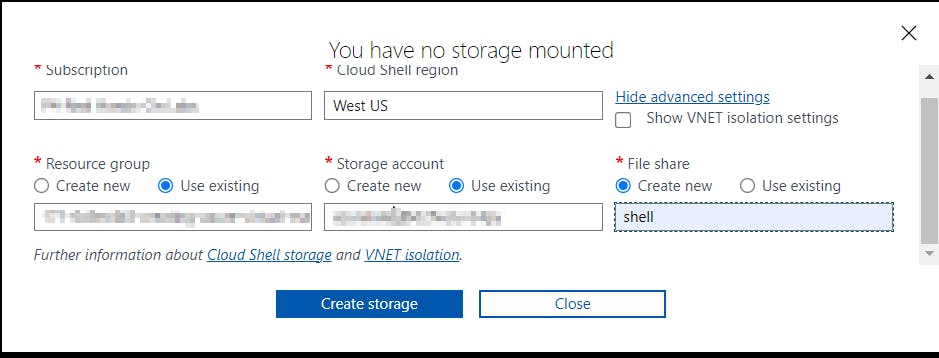
- Click Show Advanced Settings. Use the combo box under Cloud Shell region to select the Region. Under Resource Group and Storage account(It's a globally unique name), enter a name for both. In the box under File Share, enter a name. Click ***Create storage (***if you don't have any yet).
📝Create a Log Analytics Workspace
Using the main menu dropdown click on + Create a resource.

Search for "log analytics workspace" and select the option that appears.
Click on Create to create a new Log Analytics Workspace.

📝Create the workspace with the following details:
Fill out the Basics page:
Subscription: Select your subscription
Resource Group: Select the existing resource group
Name: Create a unique name like,
demologRegion: Use the same region as your existing resources
Click on Next.
Fill out the Pricing tier:
- Pricing tier:
Pay-as-you-go
- Pricing tier:
Click on Review + Create.
Click on Create.

📝Connect VM to Log Analytics
Use the Azure Portal to create a new Log Analytics workspace.
Navigate to the Log Analytics workspace, you just created.
Click on 'Virtual machines' within the 'Workspace Data Sources' section of the resource menu.
Click on 'vm1'.
Click 'Connect'.

Review the following to verify that Log Analytics is working as expected. For example:
VM Extensions:
Click on VM1 and then Extensions to review the information.
Expect: MicrosoftMonitoringAgent now installed

Log Queries:
Click on Log Analytics workspace then Logs and check the information.
Expect: Computer availability sample queries will provide information on
vm1.
Workbooks
Click on Log Analytics workspace then Workbooks and check the information.
Expect: Agent Health and similar workbooks will show information for
vm1.

📌Note - At the end of each hands-on Lab, always clean up all the resources previously created to avoid being charged.
Congratulations — you have completed this hands-on lab covering the basics of configuring Azure Log Analytics to set up virtual machine monitoring.
Thank you for reading. I hope you understood and learned something helpful from my blog.
Please follow me on CloudDevOpsToLearn and LinkedIn, franciscojblsouza